Modeling Cathode Cooling Due to Power Interruption
Marc Dupuis1 and Alton T. Tabereaux2
1 GéniSim Inc., 3111 Alger St., Jonquière, Québec, Canada G7S 2M9
marc.dupuis@genisim.com
2 Consultant, 1585 Wilson Lake Shores, Muscle Shoals, AL, USA 35661
attaber@aol.com
Keywords: Modeling, Cooling, Thermal Gradients, Cathode Cracks
Abstract
electrolyte temperature typically decreases at a rate of 15-20°C
Extended electrical power interruptions often result in the
per hour. Cooling the electrolyte in cells below ~850 °C results in
shutdown and restart of aluminum cells in potlines. Cooling cells
the solidification of bath and the shutdown of the operating cells
to ambient temperature causes irreversible and non-repairable
in the potlines. Astonishingly, some potlines have been reported
damage to the carbon cathode lining, and ultimately causes the
to have survived power interruptions up to 8 hours.
formation of numerous, often deep, cooling cracks on the surface
of cathode blocks and in the seams between blocks and ultimately
Modern cells lose heat at a faster rate when power interruptions
shorten potlife. It had been proposed that these cracks are caused
occur in potlines and thus are at a high risk compared with older
because the strain setup by thermal gradients in the cooling
cell technologies. Modern cells are deliberately designed to
cathode lining exceeds the strain capacity of the cathode, but
achieve a high heat loss by; enhanced cooling of the steel cathode
heretofore there has been no supporting evidence to support this
shell using fins, fans and forced air cooling; increased duct
hypothesis.
evacuation velocity; larger anodes, larger cross-section collector
bars and diameter steel stubs in anodes.
New ANSYS® based thermal cooling models, (2D+ full cell slice
model, 3D full side slice model and a 3D full cell quarter) were
Cathode Cooling Cracks
developed to determine the cathode cooling rates, the differences
The rapidly cooling of aluminum cells from 960°C to ambient
in the temperature gradients and the resultant stress from cooling
25°C due to potline shutdown results in the generation of cooling
cathodes for
24 to
48 hours. The results indicate significant
cracks on the cathode surface of nearly all cells in which the metal
temperature gradients and corresponding stress develop during
pads are removed and the surface is cleaned for inspection. The
cooling to cause cracking of the cathode blocks. Reducing the
cracks are formed in the cathode block during cooling and not
aluminum metal level in cells during cooling was found to reduce
during cell operation as indicated by the absence of bath or a
the level of stress and thus reduce, if not eliminate the cathode
yellow film of aluminum carbide on the surfaces of the crack.
surface cracks.
The width of observed cooling cracks observed is from 1.6 to 3
mm; they often extend the length of the cathode blocks, ~300 cm.
Introduction
The distances between cooling cracks vary widely, but are
typically found to occur about two cathode blocks apart.
During the past ten years, the shutdown and restart of aluminum
potlines due to power interruptions have become all too frequent
The Fracture Behavior of Carbon
events in the aluminum industry. Ten major power interruptions at
The thermo-electro-mechanical behavior of new cathode carbon
aluminum smelters were reported during the past ten years.
has been described as elastoplastic. [Reference 2] Carbon cathode
[Reference 1] The majority of smelters that had long-duration, (>3
blocks initially behave elastically with reversible deformation as
hours) power interruptions because of the transformer/rectifier
stress is applied, but when stress increases the carbon material
failures were built 20 to 40 years ago. Harsh weather conditions
such as ice storms, snow and high wind velocity are also a major
starts to behave in a plastic manner with irreversible deformation
factor in causing long-duration power interruptions. A somewhat
until fracture occurs. Microcracks can be generated during the
surprising development is that some new modern high-amperage
calcinations and graphitization of cathode carbon materials.
smelters have recently experienced long-duration power
During loading the microcracks are gradually closed with volume
interruptions that resulted in the shutdown of potlines due to the
contraction. Thereafter, when stresses become high, macrocracks
temporary loss of power at their power generation stations and/or
are initiated in the material and begin to propagate until failure
national grid system.
occurs. The cathode carbon is weakened as it undergoes ductile-
Cell Cooling
brittle transformation during cell operation due to the cathode
lining eventually becomes saturated
(>3%) with sodium that
Cooling occurs in all cells in the potline when the amperage is
intercalates and absorbs into the carbon lattice. This causes
significantly reduced or power is interrupted. When the power
swelling and changes the properties of the carbon lining which
input to cells is stopped, the internal cell heating due to the “Joule
makes the cathode material less ductile and more brittle.
heating” effect stops. But, cells continue to dissipate heat at nearly
Additionally cathode blocks are significantly weakened by micro-
the same rate as during normal operations with approximately
35% of the heat being transferred from the sidewalls 45% of the
cracking caused by the diffusion of sodium into the carbon lattice.
heat is transferred from top area of cells. When power is off, the
Thermal Gradients in the Cathode Lining
By adding the liquid zone, it is no longer possible to control the
Rapid cooling of cathodes due to power interruption generates an
heat transfer between the liquid and the solid zones at the ledge
uneven temperature distribution in the cathode lining which
profile surface. This is not desirable but in the case of a cooling
model, unavoidable.
results in a thermally induced mechanical stress sufficient to cause
cracking. During cooling the top of the cathode blocks cool faster
Effective Thermal Conductivity of the Liquid Metal
than the bottom of the cathode blocks resulting in large
The key characteristic of the cooling of a cell is that the top
temperature gradients in the cathode lining. Sørlie and Øye,
section of the cathode block is cooling faster than the bottom
[Reference 3] report that, “due to the very limited elasto-plastic
section. This is explained by the fact that there is very little
deformation properties of carbon during rapid thermo-mechanical
thermal resistance between the metal pad and the side ledge and
strain, the accumulated stress will be released in the form of
that the liquid metal is a very good heat conductor even when it is
motionless. Yet, during the cooling of the cell, the metal pad is
surface energy as the bottom cooling cracks.”
not motionless, as it is put in motion by natural convection force
that further enhances its effective thermal conductivity.
Once a cathode has developed cracks, gaps, etc. there is no known
method to repair the damage. The rapid cooling of cells to 25°C
The concept of effective thermal conductivity is a convenient way
due to power interruptions results in irreversible and non-
to account of the effect of the heat transfer by natural convection
repairable damage to cathodes. Cooling cracks weaken the carbon
in the metal pad without having the model the natural convection
lining as some may fill with aluminum upon restart; some cracks
flow itself. Using the equation 11 proposed by T. Hadgu and al.,
continue to expand and link up and become a basis for failure in
[Reference 8] the effective thermal conductivity of the liquid
the future. The average loss in pot life due to shutdown and restart
metal pad was estimated to be around 20 times its motionless
of individual potlines is about 200 days, but varies from 100 to
thermal conductivity as the metal pad Rayleigh number was
400 days at different aluminum smelters.
estimated to be around 4.9E8:
Thermal Cooling Modeling
keff = 0.057 * Ra0.296
(1)
New ANSYS® based thermal cooling models, (2D+ full cell slice
2D+ Full Cell Slice Transient Thermal Model
model, 3D full side slice model and a 3D full cell quarter) were
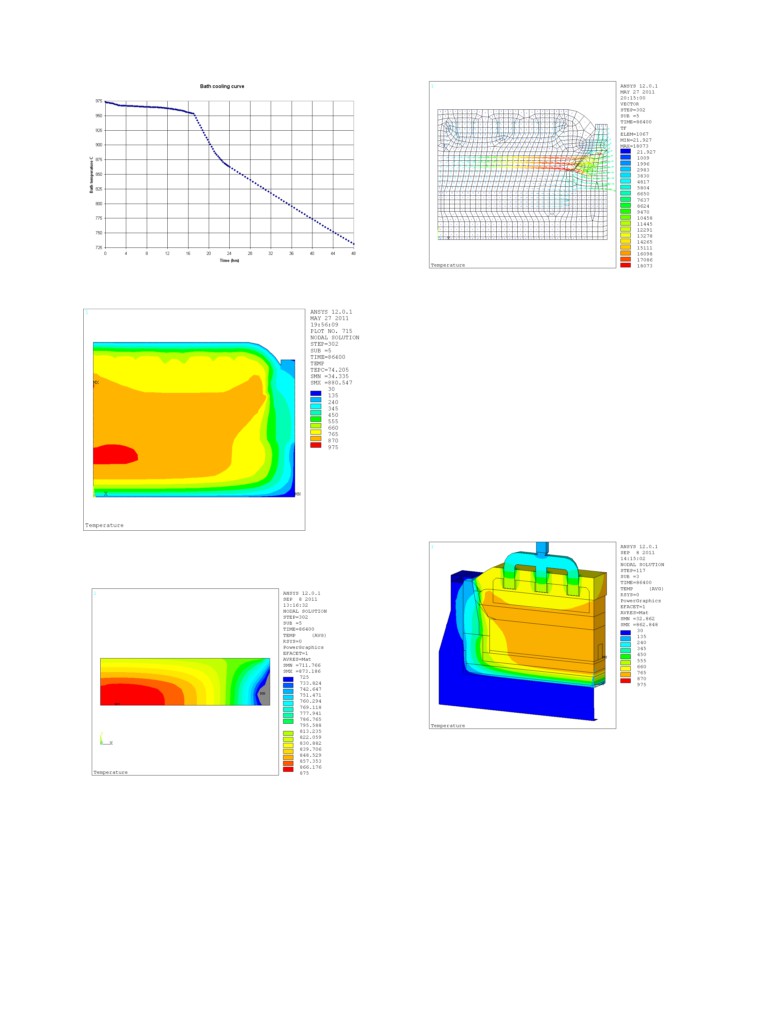
Figure 1 presents the bath cooling cure obtained from the initial
developed to determine the cathode cooling rates, the differences
steady-state thermal solution of the 2D+ full cell slice model. This
in the temperature gradients and the resultant stress from cooling
type of 2D model effectively represents the thermal effects of the
cathodes for 24 to 48 hours.
anode rod, yoke and stubs and the cathode collector bars by
representing them as extra 1D line elements hence the name 2D+.
Modeling of the cell cooling after power interruption is not
[Reference
5] From the initial condition, the
2D+ transient
different from modeling cell preheating.
[Reference
4] For
thermal (only) cooling model calculates the cooling down of the
example, the GeniSim’s demo cell geometry used in cathode
cell using exactly the same external boundary conditions as the
preheat models, was used to develop the thermal cooling models.
steady-state thermal-electric model, so the initial heat losses are
The demo cell geometry was taken from a previous thermal
exactly the same as the cell steady-state heat losses. Those heat
modeling work. [References 5 and 6] It is a relatively modern cell
losses will gradually decrease as the cell temperature gradually
design concept, but is obviously lacking the most recent
decreases. The bath solidus was specified to be 930 °C in all the
innovations in cell design:
models, so the first bath cooling phase is when the bath is in the
1) It uses
30% graphitic cathode block rather that
100%
gradually freezing mushy zone. The final cooling rate of the bath
graphitized cathode block.
is 5.5 °C per hour.
2) It uses
30% graphitic side blocks rather than graphite or
silicon carbide sidewall blocks
The thermal solution of the cathode lining after
24 hours of
3) It does not use cooling fins or compressed air cooling.
cooling is shown in Figure 2. It is very important to notice that
after
24 hours of cooling, the model predicts that the bottom
The initial conditions of the cooling models are those obtained by
section of the cathode block will be hotter that the top section.
the steady-state thermo-electric models. [References 5 and 7] The
prebake cell is operating at 300 kA and 0.73 A/cm2 of anode
The reversed vertical thermal gradient in the cathode block are the
current density. The cell is dissipating 610 kW while operating
major features of the results shown in Figure 3. The top surface of
with a 6° liquidus superheat and 7 cm of ledge at the bath level
the cathode block is already at 822 °C in the middle of the block
and 4 cm ledge at metal level. The cell is operation at a 5 cm ACD
while the bottom surface directly below is still at 873 °C. This
with 20 cm of metal and 20 cm of bath.
clearly indicates that the top section of the cathode surface is
cooling much faster that the bottom section.
Contrary to the approach used in steady-state models, the liquid
zone as been added to the cooling models. Both the initially liquid
This can be easily explained by looking at the thermal flux in the
bath and metal new materials have time dependent properties that
cell after 24 hours of cooling as shown in figure 4. The aluminum
cover the physic of the phase change:
metal pad is channeling the heat coming from the top of the
1) Different thermal conductivities before and after the phase
cathode blocks and of the bottom of the bath out through the side
change
walls as it is the less resistive path for the heat to escape out of the
2) Different specific heat before and after the phase change
cell. Note that the cooling model is not predicting that the ledge at
3) Different specific heat between the liquidus and the solidus
the metal level will get thicker.
temperature to cover the latent heat of fusion
Figure 1: Bath cooling curve
Figure 4. Thermal flux in the cell after 24 hours of cooling.
3D Full Cell Slice Transient Thermal Model
2D+ models are excellent tools to quickly test new modeling
approach or new design proposal, but they also have serious
geometric limitations. For example, is it obvious that it is only
possible to use the obtained thermal results to run a 2D thermal
stress analysis which are presented later in this article.
The next level of complexity after the 2D+ full-slice of a cell is
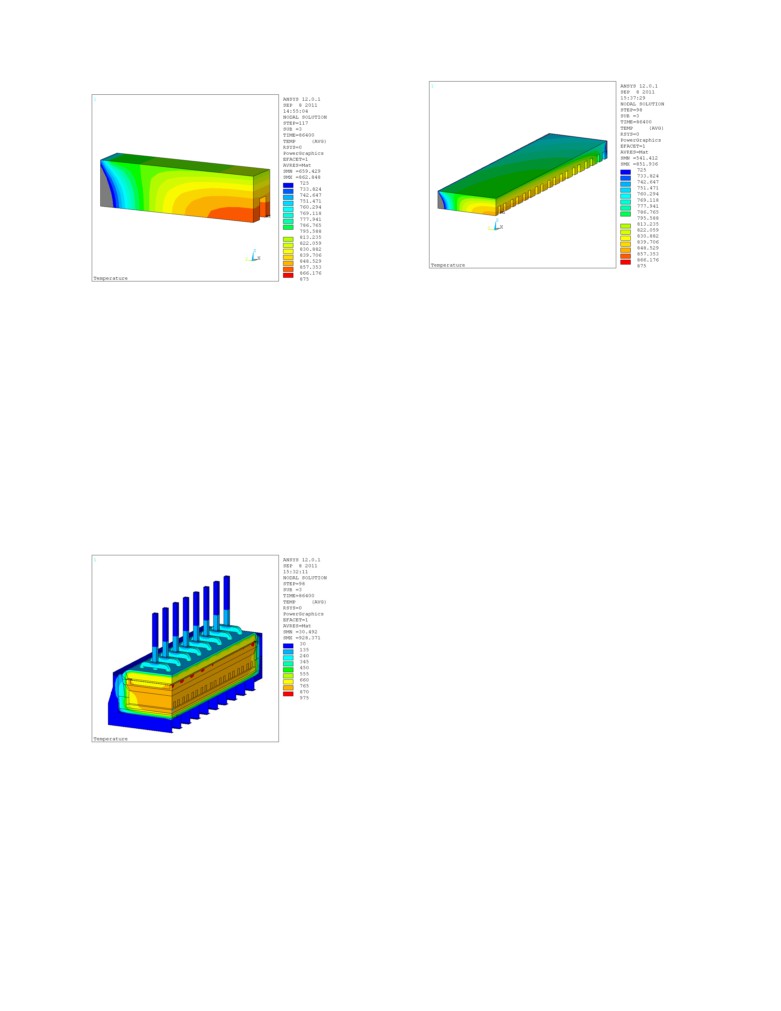
the 3D full-slice of a cell. The thermal solution for the 3D full-
slice of a cell is shown in Figure 5 after 24 hours of cooling. The
cooling characteristic for the anode rod, anode yoke and stubs and
the cathode collector bar are better represented in such a model
compared with 2D+ thermal models. In addition the cooling effect
of the welded cradle is accounted for in the 3D thermal model. As
a result the cell is predicted to cool a little faster with this type of
model.
Figure 2. 2D full slice temperature profile
after 24 hours of cooling.
Figure 5. 3D full-slice of a cell temperature profile
after 24 hours of cooling.
The drawback for the extra accuracy obtained in 3D thermal
Figure 3. 2D temperature of the cathode block
models is that the turn-around time increases due to the time
after 24 hours of cooling.
required for each step size in the model calculations. Because the
cell cooling rate is relatively slow a 5 minutes time step size was
Because it is only a 2D+ model, the calculations ran relatively
used to solve the transient 3D slice model and as a result it took
fast, a
64 bits dual core Intel Centrino T9300 Dell Precision
only 23.3 minutes wall clock time to model 48 hours of cooling.
M6300 portable computer running ANSYS® 12.0 version took
only 20 minutes elapse time to solve for 48 hours of cooling using
The reversed vertical thermal gradient in the cathode block are
a 1 minute time step.
highlighted again in figure 6. The top surface of the cathode block
has decreased to 814 °C, in the middle of the block, while the
bottom surface directly below is at 862 °C.
Figure 8: 3D temperature profile of the cathode block panel
Figure 6: 3D temperature profile of the cathode block
after 24 hours of cooling.
after 24 hours of cooling.
Thermo-Mechanical Modeling
3D Full Cell Quarter Transient Thermal Model
It would appear that a 3D full cell slice thermal model provides a
2D Cathode Block Elastic Thermo-Mechanical Model
lot more information for very little extra turn-around time.
Once thermal results have been generated using transient thermal
Obviously, the 2D+ full cell slice thermal model would run 5 time
models the next step is to use those thermal results to carry out the
faster with the same 5 minutes time step that was used with the
thermo-mechanical analysis. This step can be quite difficult as the
3D full cell slice model. But more importantly, a 3D thermal slice
mechanical behavior of the cell lining is quite complex. First,
model is not that much more useful that a 2D+ thermal model in
contrary to the thermal problem, in initial state on the mechanical
order to run a thermal stress analysis because there is no set of
problem is totally unknown. Some thermo-electro-mechanical
obvious of mechanical boundary condition that can be apply on
models of cell preheating have been reported in the literature.
the second Y-Z plane. For that reason, there is no substitute for
[Reference 9] There are also cathode swelling mechanical models
running a full cell quarter thermal model. The thermal solution for
available.
[Reference
10] But no thermo-electric-chemical-
a full cell quarter thermal model is shown in Figure 7 after 24
mechanical models of the cell in steady state operation have been
hours of cooling of the cathode lining. It is oblivious that the
model to date.
corner section of the cell cools faster than the center section so
globally the
3D full-quarter cell is predicting that the cell is
The first type of thermo-mechanical model developed in this work
cooling a bit faster than the 3D full cell slice model.
is the simplest possible, it is a 2D plain strain elastic thermo-
mechanical model. It only models the cathode block in 2D using
elastic mechanical properties to represent the cathode block
mechanical behavior which is a large simplification of the actual
problem.
Furthermore, is assume that time zero in steady state operating
condition, the cathode block is stress free under no mechanical
constrains. As cooling proceed, the thermal load that will be use
to carry the thermo-mechanical study is the differential
temperature between the current thermal condition and the initial
steady-state thermal conditions. The thermal stresses that will be
generated will be produced by the non-uniform shrinkage of the
cathode block caused by the thermal gradient of that differential
temperature in the block.
That thermo-mechanical analysis can be carried out independently
Figure 7. 3D Full-quarter cell temperature profile after
using any set of thermal results obtained during the transient
24 hours of cooling.
thermal analysis. It is possible to proceed this way because, for
this simple type of thermo-mechanical analysis, the results are not
The thermal solution of only the cathode panel is shown in Figure
path dependent. Because the reversed vertical gradients are at the
8. The top surface of the cathode block has decreased to 804 °C,
maximum after 24 hours of cooling, the stress results will be
in the middle of the panel, while the bottom surface directly below
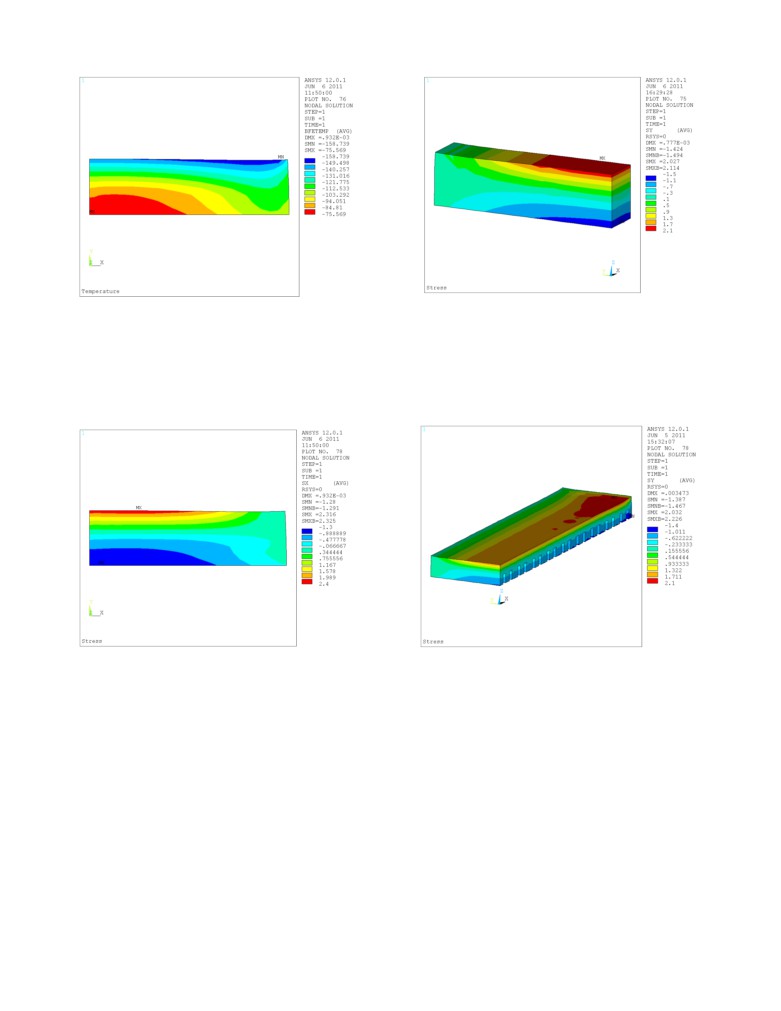
presented for that point in time in the cooling process. Figure 10
is at 851 °C. The 3D full-quarter cell model took 7.8 hours wall
shows that after 24 hours of cooling, the temperature at the top
clock time to model 24 hours of cooling.
edge of the cathode block had dropped by 159 °C while it has
only dropped by 76 °C at the middle of the bottom section.
Figure 11. Thermal stress in the cathode block
Figure 9. Differential temperature profile of the cathode block
after 24 hours of cooling.
after 24 hours of cooling.
3D Quarter Cathode Panel Elastic Thermo-Mechanical Model
Stress in the long direction on the cathode block (which is the X
The 3D quarter cathode panel thermo-mechanical model is the
direction for the 2D model) will be presented. Positive number
only type of mechanical model that can produce reliable stress
indicate tension while negative values indicate compression.
prediction in the long direction of the cell (X direction in the 3D
Cathode block will crack under tension and as we can see in
models) which is the direction that is responsible to creating
figure 10, the top block section is indeed predicted to be under 2.3
cracks that will run along the long direction of the cathode block.
MPa of tension stress.
Figure 10. Thermal stress in the cathode block
Figure 12: Thermal Y stress in the cathode panel
after 24 hours of cooling.
after 24 hours of cooling.
3D Cathode Block Elastic Thermo-Mechanical Model
The mechanical stress in the Y direction is shown in Figure 12 for
The
3D cathode block thermo-mechanical model uses the
comparison purposes with the 2 previous type of models and in
geometry and the thermal results of the 3D full cell side-slice
the X direction in the figure 13. The tension stress in the Y
thermal model. This type of mechanical model presents a problem
direction increases up to 2.2 MPa in the middle top section of the
on mechanical boundary condition on the second Y-Z plane
cathode panel, close to the end wall. The increase in the tension
(notice that the Y direction is the long direction of the cathode
stress in the X direction is only up to 1.5 MPa in the middle of the
block in the case of the 3D models, the Z direction is the vertical
first cathode block close to the end wall. Thereafter there is a local
direction). A repetitive symmetric boundary condition was used
maximum at the middle of each cathode block in the cathode
which assumes that the cell is infinitively long.
lining.
So again for the type of mechanical model looking at the
Thus the current model cannot explain why the most common
predicted stress in the long direction of the cell (width of the
cracks are running along the long direction of the cathode block
cathode block) is not realistic due to the inaccurate boundary
rather than along the long direction of the cell as it is predicts the
condition. Stress in the long direction of the cathode block after
reversed. There are many possible explanations for these results.
24 hours of cooling are presented in figure 11, they are quite
One of them is that the current model does not considering the
similar to the one obtained with the 2D model with the prediction
small joint between block to have the exact same thermal and
of 2.1 MPa of tension stress at the middle top section of the
mechanical properties as the cathode blocks; this is potentially an
cathode block.
over simplification.
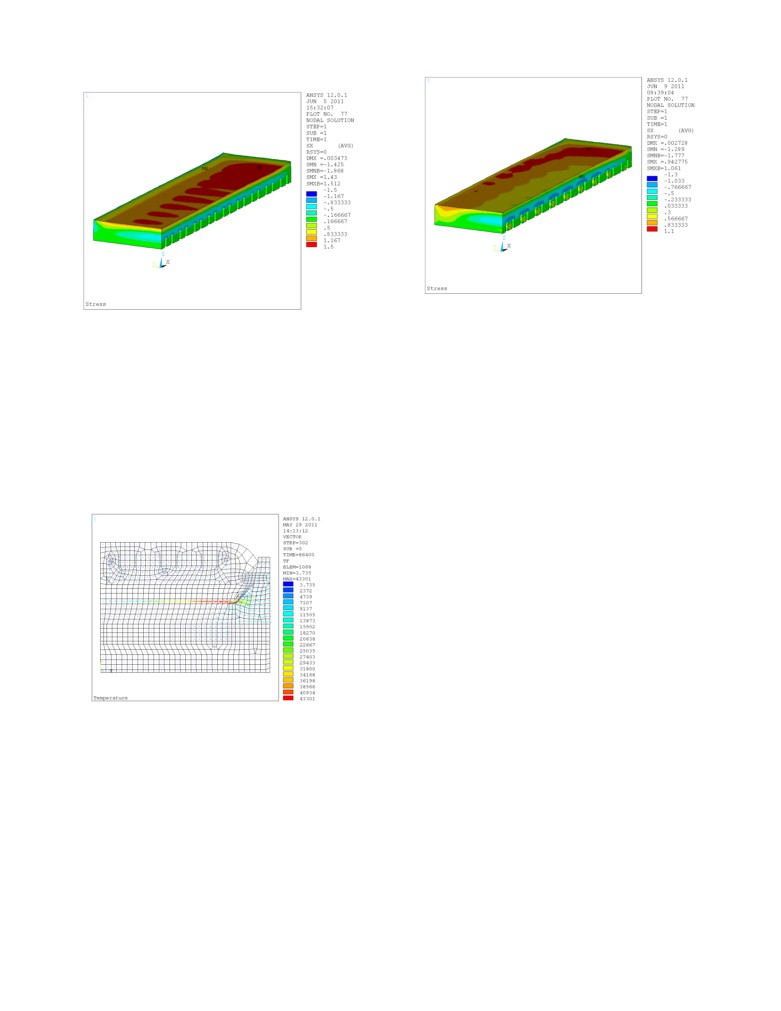
Figure 15: Thermal X stress in the cathode panel
Figure 13: Thermal X stress in the cathode panel
after 24 hours of cooling with 2/3 metal removed.
after 24 hours of cooling.
References
Models Applications
1.
A.T. Tabereaux, Light Metals Age, Electrical Power
Even if the current thermo-mechanical cooling models are not
perfect, they never-the-less constitute useful tools to investigate
Interruptions: An Escalating Challenge for Aluminum
and identify potential solutions to the cathode block cracking
Smelters”, February 2010, pp. 16-20.
problem due to cell cooling. Since it was clearly indentify that the
2.
G. D’Amours, M. Fafard, A. Gakwaya, and A.A. Mirchi,
reversed vertical gradient in the cathode block is generated by the
“Mechanical Behavior of Carbon Cathode: Understanding,
excessive cooling efficiency of the metal pad, the models have
Modeling and Identification”, Light Metals 2003, pp.633-
640.
been used to investigate the impact of removing
2/3 of the
3.
M. Sorlie and H.A. Oye, “Cathodes in Aluminium
aluminum metal pad at the very beginning of the cell cooling.
Electrolysis,” Aluminium-Verlag Marketing &
Kommunikation GmbH, 3rd Edition 2010.
4.
M. Dupuis, “Usage of a Full 3D Transient Thermo-Electric
F.E. Model to Study the Thermal Gradient Generated in the
Lining During a Coke Preheat”, Light Metals 2001, pp. 757-
761.
5.
M. Dupuis, “Computation of Aluminum Reduction Cell
Energy Balance using ANSYS® Finite element Models”,
Light Metals, 1998, pp. 409-417.
6.
V.A. Kryukovski, G.A. Sirasutdinov, J. Klein and G.
Peychal-Heiling, “International Cooperation and High-
Performance Reduction in Siberia”, JOM, 46(2) (1994), 23-
25.
7.
M. Dupuis, “Toward the Development of a 3D Full Cell and
Figure 14: Thermal flux in the cell after 24 hours of
External Busbars Thermo-Electric Models”, Proceeding of
cooling with 3/3 metal removed.
the 41st Conference of Light Metals, CIM, 2002, pp25-39.
8.
T. Hadgu and al., “Comparison of CFD Natural Convection
The thermal flux is shown Figure 14 when 2/3 of the metal pad is
and Conduction-Only Models for Heat Transfer in the Yucca
removed at the very beginning of the cell cooling. The resulting
Mountain Drifts”, ASME 2004 Heat Transfer/Fluids
tension stress is shown in Figure 15 in the X direction after 24
Engineering Summer Conference, pp. 223-232.
hours of cooling. The intensity of the tension stress is reduced by
9.
D. Richard, P. Goulet, M. Dupuis & M. Fafard,
1/3 to about
1.1 MPa. Reducing thickness of the metal pad
“Thermochemo-mechanical modeling of a Hall-Héroult cell
thickness even more would continue to help reducing the risk of
thermal bakeout”, Light Metals, 2006, pp. 669-672.
getting cooling cracks on the cathode surface, but there is
10.
M. Dupuis, “Mathematical Modelling of Aluminum
obviously a practical limit a how much metal can be tapped out of
Reduction Cell Potshell Deformation”, Light Metals, 2011,
cells.
pp. 417-422.