FORTRAN program to solve the coupled voltage and temperature
set of non-linear equations generated from the discretisation of a
3D busbar network geometry into a network of 1D line elements.
Nowadays, it is also possible to create an Excel spreadsheet similar
to the one presented in figure 1.
time. For efficiency reasons, it was decided to use 1D thermo-
electric line elements available in ANSYS
figure 6).
V shaped current collectors at the base of the negative risers, each
busbar has been represented by a 1D line element of identical
section and length. The external busbar surface area needs to be
calculated as an element property and again except for the V
shaped negative current collectors those surface areas are also
identical to the one automatically computed by ANSYS
and the boundary conditions are identical to the one set in the 3D
model.
ºC and in the negative busbar is 186.0 ºC. The global busbar
network voltage drop is 230 mV with 235.6 kA or 47.1% passing
in the negative side and 264.4 kA or 52.9% passing in the positive
side.
appears obvious that the negative risers section is more resistive in
the 1D model version. Clearly the 1D line elements representation
of the V shaped current collectors, which is really a 2D feature, is
not accurately enough represented.
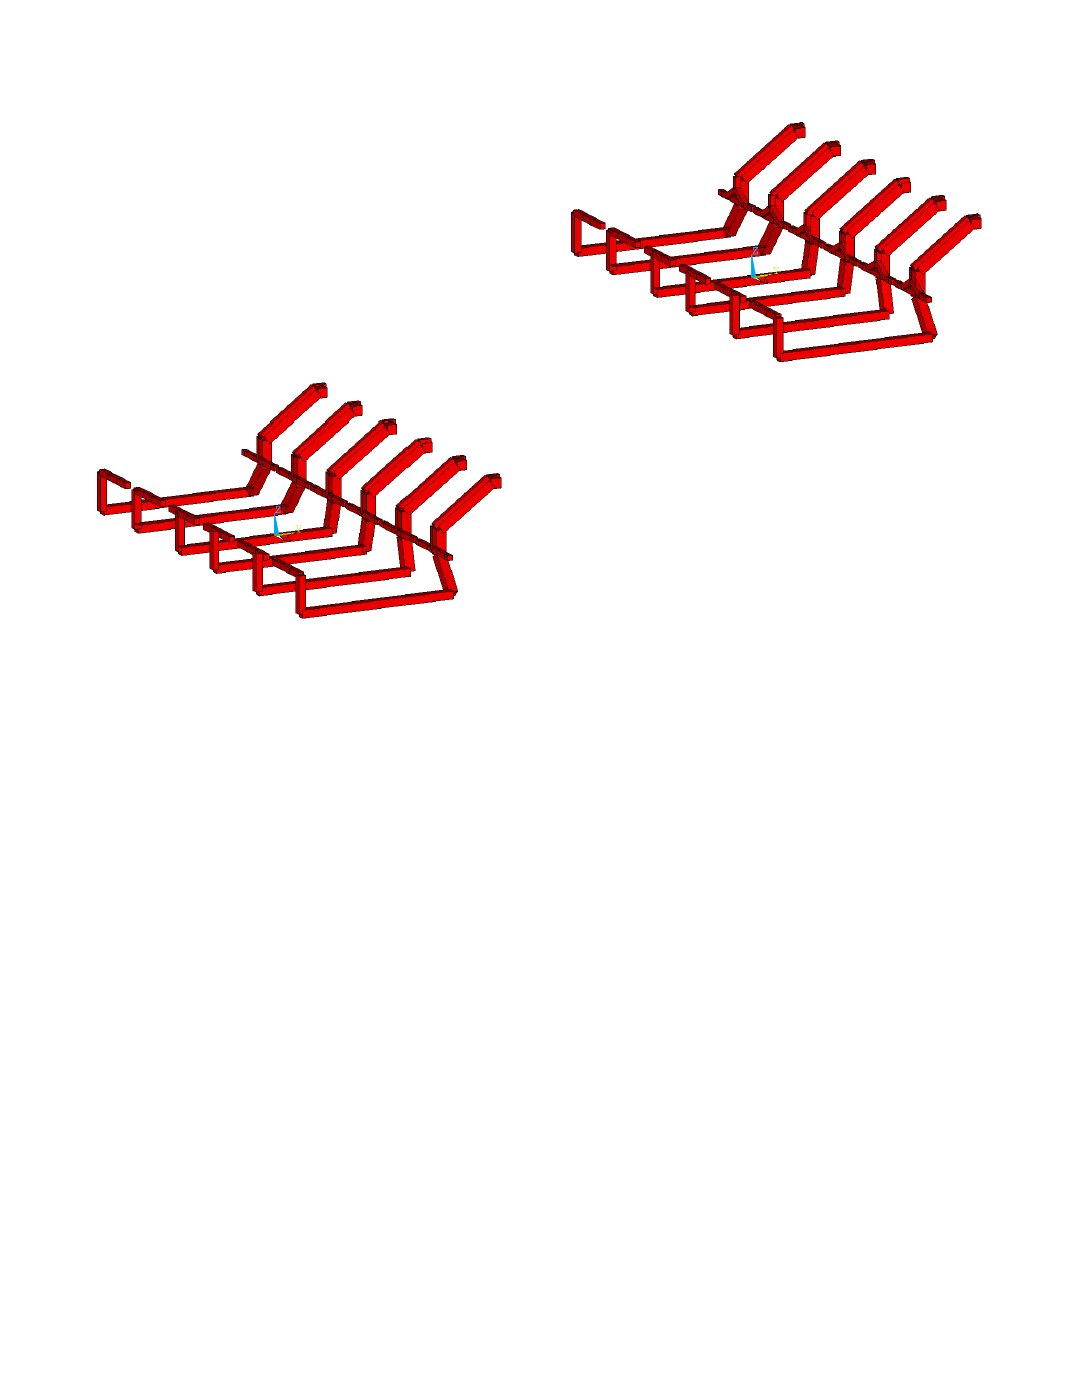
the V shaped negative current conductors (now that it is known that
it is required to do so following the comparison exercise). This only
requires the construction of a more complex 1D line elements
network (see figure 7).
reach in the positive busbar is 95.5 ºC and in the negative busbar is
190.9 ºC. The global busbar network voltage drop is 224 mV with
241.2 kA or 48.2% passing in the negative side and 258.8 kA or
51.8% passing in the positive side.
but still some discrepancies remain. This comparison exercise
highlights very well that it is not that easy to perfectly represent a
real 3D busbar geometry using only a 1D line elements
discretisation. But considering that little loss of accuracy, is the 1D
ANSYS
than a 1D model geometry. An even if it is possible to build a
parametric 3D model, there is a limit in the versatility of a single
model topology i.e. it will not be possible to analyze all the
possible busbar configuration one might want to analyze using a
single 3D model topology. So using the 3D ANSYS
configuration model topology often to use them only a few times!
This is clearly not a very practical approach.
conditions. Each busbar external surface area must be calculated
manually by the model developer and input as a material property.
setup task, it would be very cumbersome to use that approach to
carry out a busbar sizing optimization study. So neither the 3D
ANSYS
was initially developed as an in-house code for the former USSR
aluminum industry and later adapted for the in-house use at
Reynolds Metals. But it has now become available, quite
exceptionally, as a commercial software of certain unique
advantages. Because it is a specialized MHD cell stability solver, it
has been designed to perform this single task efficiently. Being a
commercial package, it is quite user friendly and comes with
customer training and support if required.
hydrodynamic programs are unified. The MHD package generates
the very large set of Kirchhoff equations set automatically from the
relatively simple unified data input. The computed temperatures of
the electrically heated bars permit to accommodate to the resistivity
changes. Additional flexibility permits to simulate anode changes,