permanent error but increased significantly the oscillation in the
response as we can see in Figure 15.
day and without any time delay is not as stable as using bath
sampling even with a much lower feedback control frequency and a
quite significant time lag.
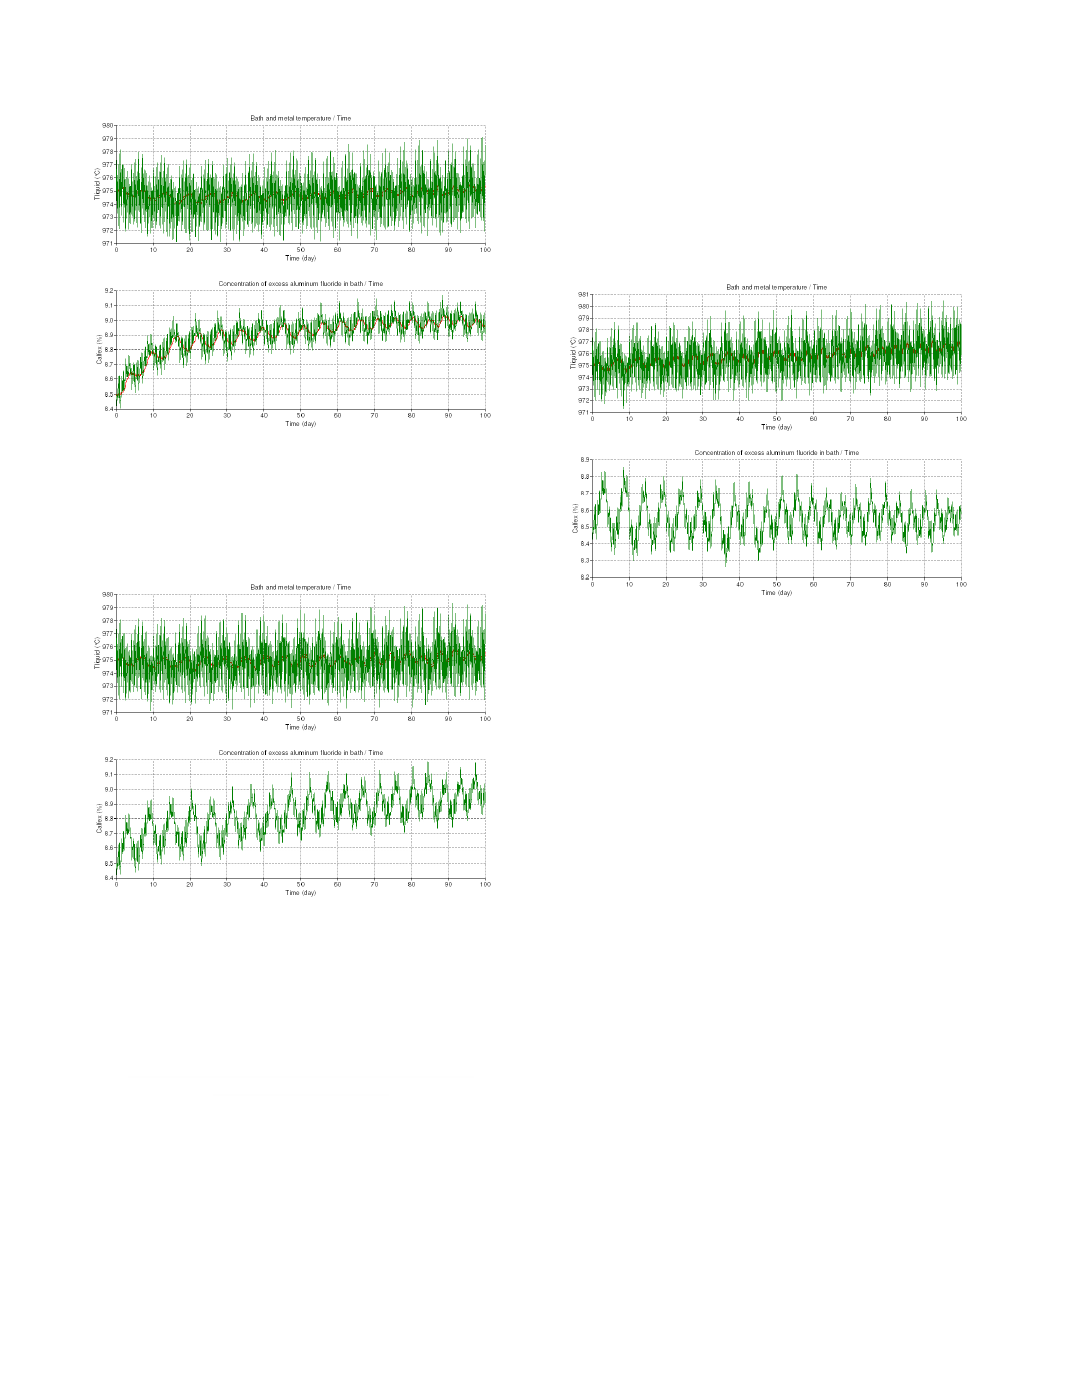
bath temperature in their control feedback loop. Is this a good idea?
temperature measurement per day, no delay
response that can be obtained using that mixed control strategy.
The bath temperature target is set to 975ºC, which is compatible
with a 8.5% excess AlF3 concentration target for that demonstration
CaF2 concentrations. All those factors are important as the
temperature measurement by 1 day reducing the risk of being out of
phase and hence inconsistent for the cell controller to act upon. The
proportional constants are set to 1 kg/hr% and 0.3 kg/hrºC
respectively.
temperature measurement per day, no delay
bath temperature in addition to the bath sample analysis only adds
instability to the response.
temperature measurement per day, no delay using inconsistent
targets
feedback responses possible. A more probable response would be
the feedback response resulting from the tug of war itself resulting
from setting inconsistent targets between the 2 parts of the
controller.
affecting the correlation between the excess AlF3 and the bath
excess AlF3 vs. bath temperature correlation when the CaF2
correlation. Similar shift in the correlation will occur if the cell
superheat is increasing due to cell amperage increase per example.
In fact, the list of factors affecting that correlation is extremely
long: bath chemistry excluding excess AlF3, cell amperage, ACD,
controller targets will become inconsistents. Case 2 is identical to
Case 1 in all aspects except that the bath temperature target has
been set to 970ºC instead of 975ºC. Figure 18 presents the resulting
tug of war feedback control response. Clearly this is the worst type
of control response possible. Unfortunately, this is still a quite
common one in the industry even nowadays.